Secrets of the JavaScript Ninja – Debugging JavaScript
Web Code Geeks have partnered with Manning to provide you this ebook with a 39% discount! Check at the end of the article for the relevant code!
 In this article, excerpted from Secrets of the JavaScript Ninja, Second Edition, we introduce you to some of the tools that can be used for debugging JavaScript.
For a long time, the development of JavaScript applications was hindered by the fact that the only way to debug our JavaScript code was to scatter alert statements, that would notify us about the value of the alerted expression, all around the code that’s acting strangely. As you might imagine, debugging (hardly ever a fun activity), was made even more difficult by this lack of basic debugging infrastructure.
Luckily for us, around 2007, Firebug, an extension to Firefox, was developed. Firebug holds a special place in the hearts of many web developers, since it was the first tool that has provided us with a debugging experience that closely matched debugging in state of the art integrated development environments (IDE’s), such as Visual Studio or Eclipse. In addition, Firebug has inspired the development of similar developer tools for all major browsers: F12 Developer Tools, included in Internet Explorer and Microsoft Edge; WebKit Inspector, included in Safari; Firefox DevTools, included in Firefox, and Chrome DevTools included in Chrome and Opera. Let’s explore them a bit.
Firebug
Firebug, the first advanced web application debugging tool, is available exclusively for Firefox, and is accessed by pressing the “F12” key (or by right-clicking anywhere on the page and selecting “Inspect element with Firebug”). You can install Firebug by opening the page: https://getfirebug.com/ in Firefox and following the given instructions. Firebug is shown in the following figure.
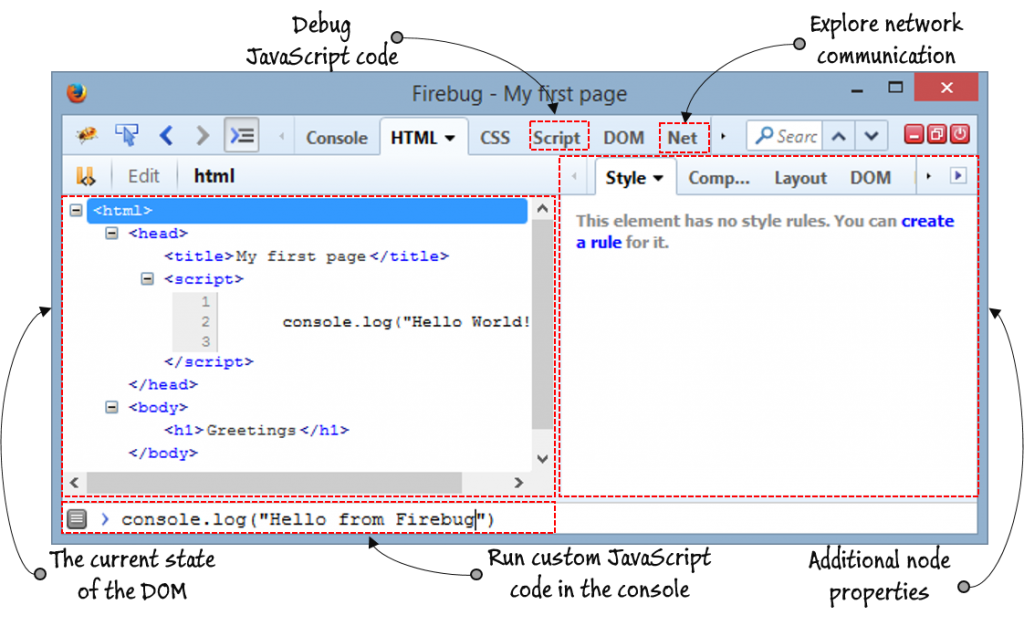
Firebug offers a number of advanced debugging functionalities, some of which it has even pioneered. For example, we can easily explore the current state of the DOM by using the “HTML” pane (the pane shown in figure 1), run custom JavaScript code within the context of the current page by using the console (the bottom of figure 1), explore the state of our JavaScript code by using the “Script” pane, and even explore network communications from the “Net” pane.
Firefox DevTools
In addition to Firebug, if you’re a Firefox user, you can use the built-in Firefox DevTools, shown in the following figure.
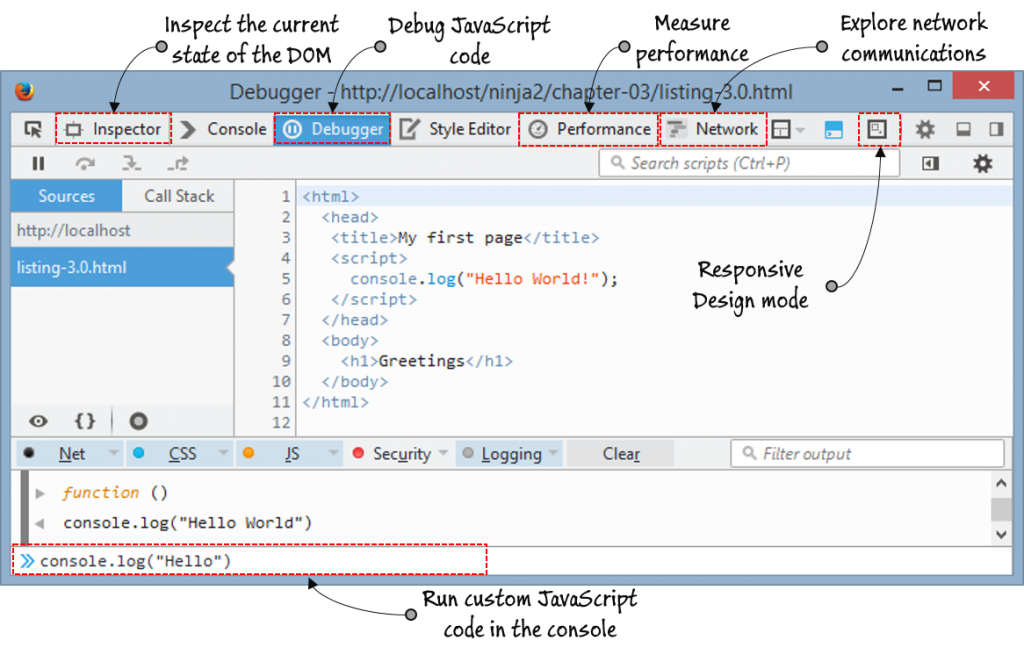
As you can see from figure 2, the general look and feel of Firefox DevTools is very similar to Firebug (apart from some minor layout and label differences, for example the “HTML” pane from Firebug is called “Inspector” in Firefox DevTools).
Firefox DevTools are built by the Mozilla team, and they have taken advantage of this close integration with Firefox by bringing in some additional features, such as the “Performance” pane with which we can get detailed insight about the performance of our web applications. In addition, Firefox DevTools are built with the modern web in mind. For example, they offer the “Responsive Design mode” which helps us explore the look and feel of our web applications across different screen sizes, which is something we have to be careful about, since nowadays users access our web applications not only from their PCs, but also from mobiles, tablets, and even TV’s.
F12 Developer tools
In case you’re in the Internet Explorer (IE) camp, you’ll be happy to know that IE and Microsoft Edge (the successor to IE) also offer their own developer tools, the F12 developer tools. (Quickly, try to guess which key toggles them on and off.) The F12 developer tools are shown in the following figure.
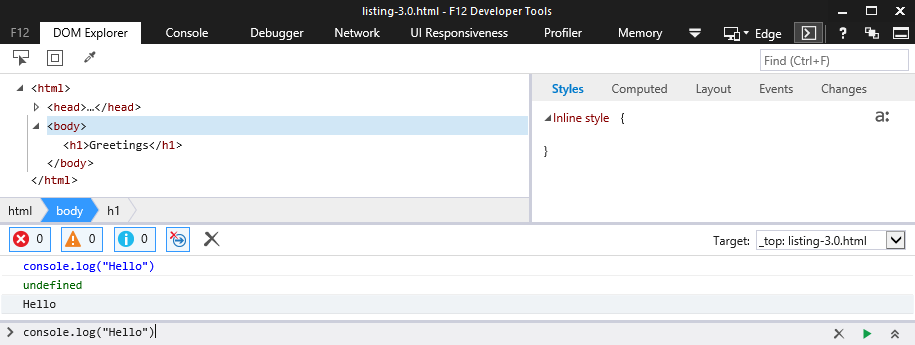
Again, notice a number of similarities between the F12 developer tools and Firefox’s DevTools (with only slight differences in labels); the F12 tools also enable us to: explore the current state of the DOM (the “DOM Explorer” pane, figure 3), run custom JavaScript code through the console, debug our JavaScript code (the “Debugger” pane), analyze the network traffic (“Network”), deal with responsive design (“UI Responsiveness”), and analyze performance and memory consumption (“Profiler” and “Memory”).
WebKit inspector
If you are a Mac OS user, you can use WebKit Inspector, which is offered by Safari, as shown in the following figure.
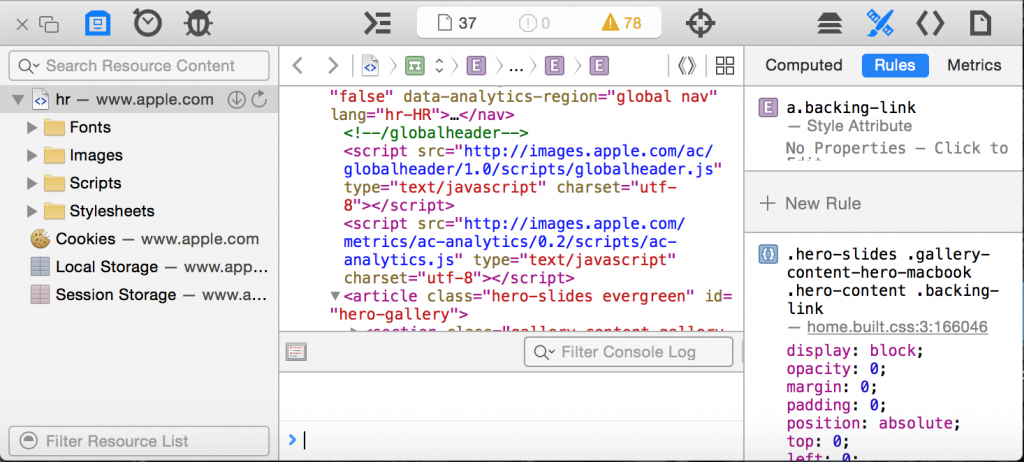
While the UI of Safari’s WebKit Inspector is slightly different than that of F12 developer tools or Firefox’s DevTools, rest assured that the WebKit Inspector also supports all important debugging features.
Chrome DevTools
We’ll complete our little survey of different developer tools with Chrome DevTools. In our opinion, it’s the current flagship of web application developer tools that’s been driving a lot of innovations lately. As you can see in figure 5, the basic UI and features are again quite similar to the rest of the developer tools.
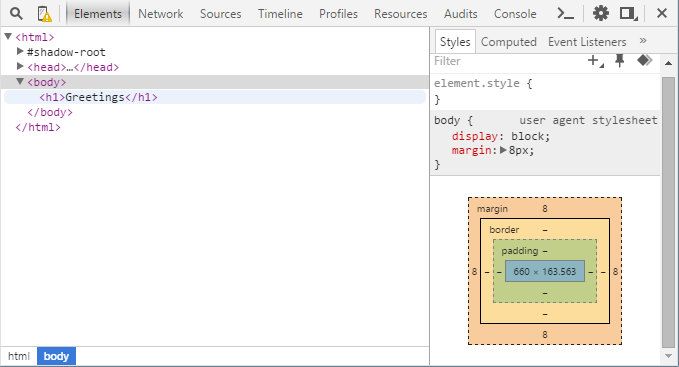
Most of the developer tools offer basically the same features (and if one of them offers something new, the others catch up quickly), so you can just as easily use the developer tools offered by your browser of choice.
Web Code Geeks have partnered with Manning to provide you this ebook with a 39% discount!
Use code wcg16 to get your discount for the book Secrets of the JavaScript Ninja. Enjoy!


