Graphing Benchmark Results in Ruby
Nothing presents performance statistics quite as well as having graphs for benchmarks. Whether you want to present an alternative way for code guidelines based on performance or show a presentation, seeing the difference makes a difference. What we’ll cover here will show you how to generate graph data images from your own Ruby codebase’s benchmark suite, with presentation-worthy quality.
The benchmark I often like to use when comparing code is iterations-per-second. You can find an excellent Ruby gem for that at benchmark-ips. This will give you numbers showing how many times the code was able to run before a second passes. You write code two different ways which perform the same result, and you use benchmarking to see which one is more performant.
Now another kind of benchmark is one which graphs on one or multiple planes different values that change given different inputs. The typical graph would be an xy plane where x would be the time taken and y would be a measurement of distance, such as iterations as our case will be.
The Minitest benchmark suite has five kinds graphing benchmarks as of this writing. The ones most people will be interested in are either assert_performance_constant or assert_performance_linear.
When you try to persuade individuals about a better way of doing something, sometimes numbers don’t hold the weight they should. This is where visual graphs come into play to give a greater advantage of persuasion. Graph data can reveal the difference in more than numbers; it can reveal it at scale. When someone sees the compounded difference of system resources consumed as the code is scaled up, even the smaller savings become much more desirable.
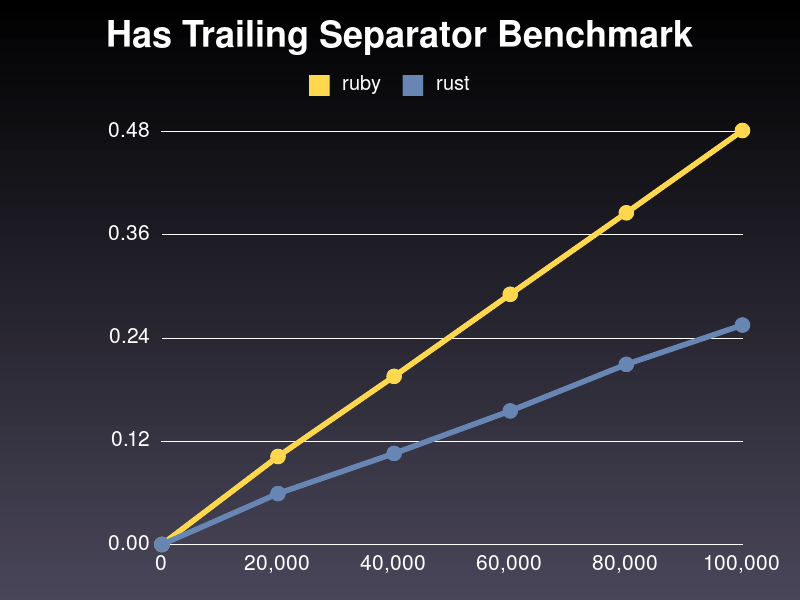
Let’s take a look at a performance benchmark from FasterPath which demonstrates how the native Ruby code runs against the Rust implementation of it.
Seeing the difference gives the impact you’re looking for. When the numbers are small, the costs don’t seem as high. But this one method alone looks to cut out about 50 percent of the execution time required for this method. You do this a few times on highly used methods, and your overall systems performance will show significant performance improvements. For example, FasterPath has given my Rails 4 site a 30 percent performance gain, as path handling is required for all website assets.
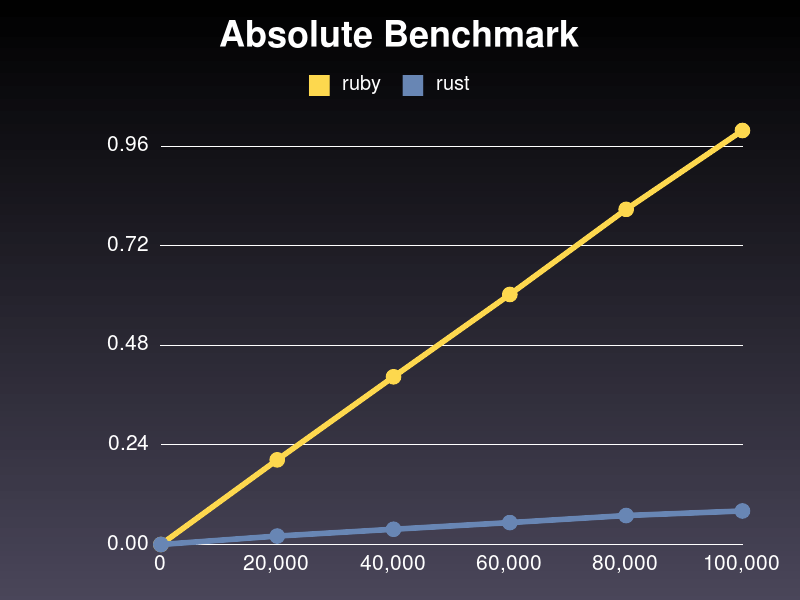
What’s more impressive to hear or see, that the FasterPath.absolute? method is 96 percent faster than Pathname.absolute?, or to see the image of it here:
Having the visual graph lets you see that while one method takes one second to run, the other is less than a tenth of a second. Even with the words stated, a visual benchmark is clearly a winner for the art of persuasion.
Now let’s write some code to produce these kinds of graphs.
The Implementation
First of all, this code uses the gruff gem which depends on RMagick. It’s a beautiful and simple interface to mark data points on a graph and will let you choose many different kinds of graphs and styles of data presentation for your image output. The next gem we’ll use is one called stop_watch, which is a simple gem that lets you have a stopwatch timer. Simply press the mark button to mark the times.
When you include the dependencies, keep in mind that RMagick may not play well with continuous integration services (and it’s not meant to be used there anyway). So you need to add a conditional to your gemspec to make sure the gems aren’t included during CI runs.
# you can place this towards the end of your gemspec
  unless ENV['CI']
    spec.add_development_dependency "stop_watch", "~> 1.0.0"
    spec.add_development_dependency "gruff", "~> 0.7.0"
  end
I’ll share two code files here and discuss them afterward. It may seem a bit long at first, but it’s been refactored down to simple methods.
# test/benchmark_helper.rb
require "test_helper"
require "minitest/benchmark"
require 'fileutils'
require 'stop_watch'
require 'gruff'

class BenchmarkHelper < Minitest::Benchmark
  def self.bench_range
    [20_000, 40_000, 60_000, 80_000, 100_000]
  end

  def benchmark lang
    assert_performance_constant do |n|
      send(lang).mark
      n.times do
        yield
      end
    end
    send(lang).mark
  end

  def graph_benchmarks
    if rust.time? && ruby.time?
      g = Gruff::Line.new
      g.title = graph_title
      g.labels = generate_benchmark_range_labels

      g.data(:ruby, graph_times(:ruby))
      g.data(:rust, graph_times(:rust))

      g.write( output_file )
    end
  end

  private
  def test_name
    File.basename(@file, '.rb')
  end

  def graph_title
    test_name.split('_').map(&:capitalize).join(' ')
  end

  def output_file
    path = File.join(File.expand_path('..', __dir__), 'doc', 'graph')

    FileUtils.mkdir_p path

    File.join path, "#{test_name}.png"
  end

  def ranges_for_benchmarks
    instance_exec do
      self.class.bench_range if defined?(self.class.bench_range)
    end || BenchmarkHelper.bench_range
  end

  def generate_benchmark_range_labels
    ranges_for_benchmarks.
      each_with_object({}).
      with_index do |(val, hash), idx|
        hash[ idx.succ ] = commafy val
      end.merge({0 => 0})
  end

  Languages = Struct.new(:ruby, :rust) do
    def initialize
      super(StopWatch::Timer.new, StopWatch::Timer.new)
    end
  end

  TIMERS = Hash.new.
    tap do |t|
      t.default_proc = \
        ->(hash, key){ hash[key] = Languages.new }
    end

  def timers
    TIMERS[@file]
  end

  def ruby
    timers.ruby
  end

  def rust
    timers.rust
  end

  def graph_times lang
    send(lang).times.unshift(0)
  end

  def commafy num
    num.to_s.chars.reverse.
      each_with_object("").
      with_index do |(val, str), idx|
        str.prepend((idx%3).zero? ? val + ',' : val)
      end.chop
  end
end
And an example benchmark test:
# test/benches/absolute_benchmark.rb
require "benchmark_helper"

class AbsoluteBenchmark < BenchmarkHelper
  def setup
    @file ||= __FILE__
    @one = "/hello"
    @two = "goodbye"
  end

  def teardown
    super
    graph_benchmarks
  end

  def bench_rust_absolute?
    benchmark :rust do
      FasterPath.absolute?(@one)
      FasterPath.absolute?(@two)
    end
  end

  def bench_ruby_absolute?
    one = Pathname.new(@one)
    two = Pathname.new(@two)
    benchmark :ruby do
      one.absolute?
      two.absolute?
    end
  end
end
And you’ll need a Rakefile task to properly load the right directories and benchmark files:
# Rakefile
require "bundler/gem_tasks"
require "rake/testtask"

Rake::TestTask.new(bench: :build_lib) do |t|
  t.libs = %w[lib test]
  t.pattern = 'test/**/*_benchmark.rb'
end
The Helper
All right, there’s a lot to cover here, so I’ll try to go from the top down. The first class method is bench_range. This method is what Minitest uses for the value to inject into each benchmark’s cycle. How you use those values is up to you. In our case, we’re simply going to run the same code that many times to present how long it takes to complete under that much work load.
The next method, benchmark, is simply for us to mark the time before and after the test is run. We piggyback on top of the assert_performance_constant method to pipe in the values from bench_range and execute our code snippets that many times with n.times yield. The send(lang) will take the symbol provided for a language and call our private method below, which produces the timer of that language. We then simply call the mark method on that timer, and it records the time.
The next method, graph_benchmarks, is run after each benchmark test in each file. Because of this, we check to make sure both benchmark tests have been run before we run the code to produce the output image of our graph. This method is the only place we’re using code for the gruff gem to produce our graph. The rest of the methods are mostly helper methods refactored out for this one method.
test_name, graph_title, and commafy are string helpers, since this project doesn’t have access to Rails for methods like titleize or to_s(:delimited).
output_file is our helper method to make sure the directory for our graphs exists and to return the path for the graph to be written to.
You may have noticed @file being used in test name and a couple of other places. In Ruby, you can use the __FILE__ method to get the name of the current file. Since the BenchmarkHelper class is a class that is inherited by each benchmark, we set the value of @file in those files from __FILE__, and further use that as a name and a hash key for benchmark results in the hash named TIMERS.
ranges_for_benchmarks is our helper method to allow us to overwrite the bench_range method in individual benchmark files; sometimes the numbers provided as default don’t give us enough data for time values (it doesn’t take long enough). The method itself first checks and uses the bench_range in the current benchmark file if it’s there. Otherwise, that returns nil and it ors over to the default.
generate_benchmark_range_labels and graph_times format the data for use in the gruff gem. The gruff gem requires that the labels be keyed by index value. The value for graph times are a simple array that corresponds to the values of their indexes. For this benchmark graph to make the most sense visually, it needs to start with zero, so we stick a zero in at the beginning of both of these. And we need to have the benchmark ranges be equidistant to each other. So for our suite, we have them incrementing at 20,000.
!Sign up for a free Codeship Account
The Benchmark File
The individual benchmark files include the benchmark helper from which we then inherit to each benchmark class.
When benchmarking, it’s very important to explicitly time only the specific code we’re interested in. Object creation in Ruby does use some time, so prepare those objects before you benchmark the code in question (when it’s feasible). In this case, Pathname.new takes a chunk of time and has nothing to do with our specific benchmark, so we prepare that beforehand. But even for objects as simple as strings, it’s better to instantiate them beforehand if they’re not part of what we’re benchmarking specifically.
Since each benchmark file has @file = __FILE__ in its setup phase, the code from the helper creates a struct of Ruby and Rust timers specifically in the TIMERS hash. The helper method timers in the helper file points at TIMERS[@file], from which our ruby and rust helper methods each point directly to their specific timer object in the struct for that file. So each file has its own entry in the TIMERS hash, which gets processed for graphs when both rust.time? && ruby.time? pass.
The time? method is part of the stop_watch gem (out timer objects), which only returns true if mark has been called at least twice to start the timer and set a mark in seconds.
The teardown method gets run after each benchmark test is run. Since it checks both rust.time? and ruby.time?, it won’t graph the data until both are true, which means that both benchmark tests have run. So the first run results with true && false, and the second with true && true, which then graphs.
With the Rakefile given above, all you need to do to run your benchmarks is to run rake bench and your resulting images will be available in doc/graph.
Summary
ImageMagick has been around a long time, allowing us to manipulate images through code. gnuplot, which uses it, has been available for graphing data for quite some time as well, albeit the code is a little bit more involved and the results a little more retro. But gruff has brought us stunning presentation-worthy visuals with a simple way to implement it. Gruff should be a tool you keep handy for when you need to help persuade others. It gives you elegance in presenting your data.
In a world were numbers are all too common, it really takes seeing the difference to get the difference. I hope that this has helped, and I wish you all the best.
| Reference: | Graphing Benchmark Results in Ruby from our WCG partner Daniel P. Clark at the Codeship Blog blog. |


