Accelerate Your Digital Business with AppDynamics Winter ‘17 Product Release
Discover faster, more efficient performance monitoring with an enterprise APM product learning from your apps. Take the AppDynamics APM Guided Tour!
Last month at AppD Summit New York, we unveiled the latest innovations in our Business iQ and App iQ platforms, paving the way for a new era of the CIO and digital business. Delivering on this vision, we’re excited to announce the general availability of AppDynamics’ Winter ‘17 Release for our customers.
As application and business success become indistinguishable, enterprises are increasing their investment in digital initiatives. According to Gartner, 71% of enterprises are actively implementing digital strategies, and IDC predicts that companies will spend $1.2 trillion on their digital transformation in 2017 alone.
But without effective tools to correlate application and business performance – and lack of end-to-end visibility across customer touchpoints, application code, infrastructure, and network – customer experiences and employee productivity are degraded, and executives can’t analyze or justify technology investments. In fact, according to McKinsey, the digital promise still seems more of a hope than a reality, with only 12% of technology and C-level executives confident that IT organizations have been effective in this shift.
Winter ‘17 Release is Here
Business iQ just got better. Bridging the gap between the app and the business, BiQ capabilities have expanded to include:
Business Journeys
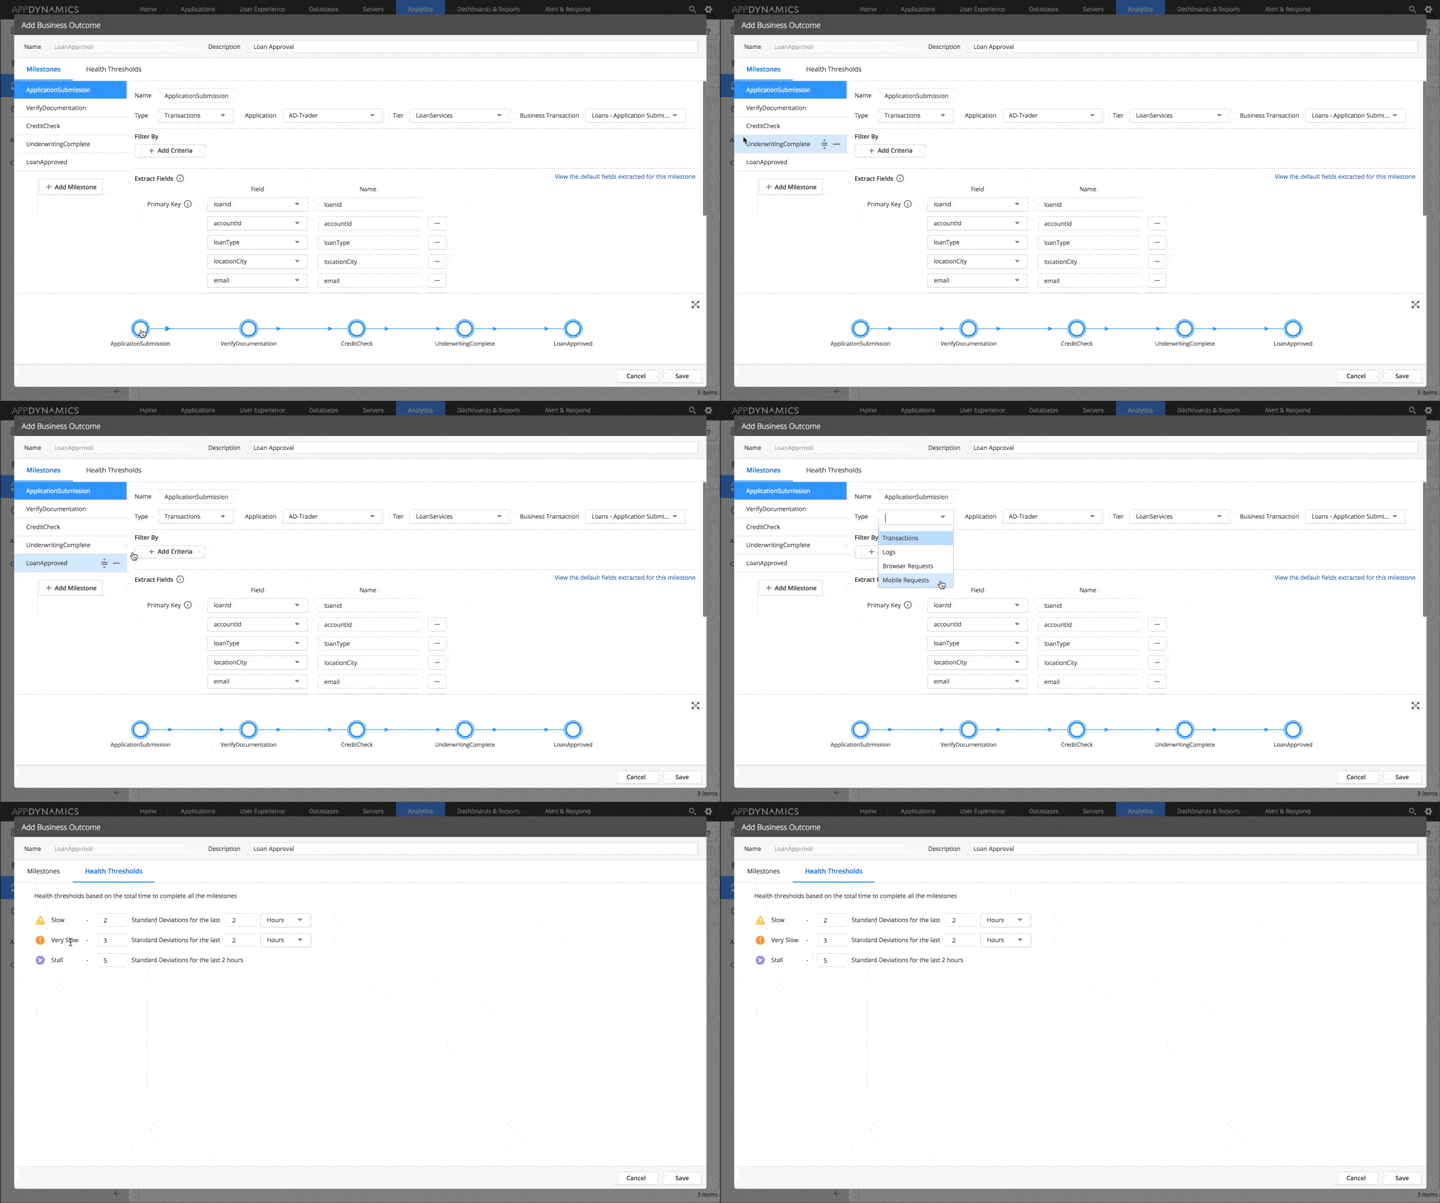
With AppDynamics Business Journeys, application teams can link multiple, distributed business events into a single process that reflects the way customers interact with the business. Business events can include transaction, log, mobile, browser, synthetics, or custom events and are long-running, from hours to days.
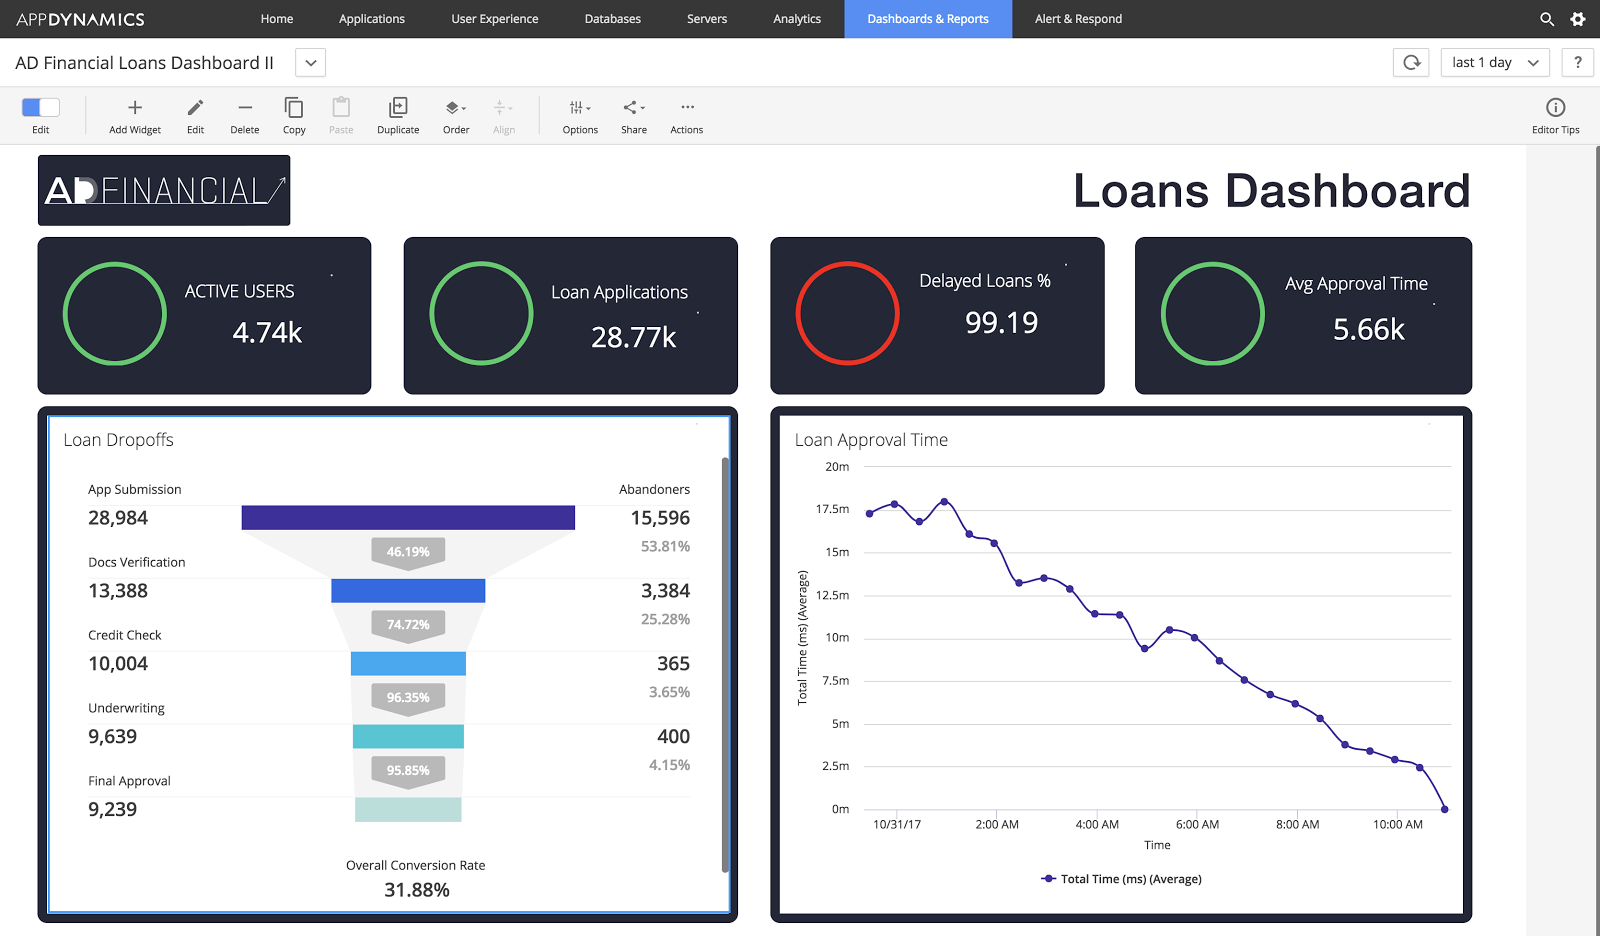
Application teams can create performance thresholds and quickly visualize where performance issues are impacting the customer experience. KPIs for each Business Journey inform technology investments and effectively prioritize code development and release.
In the two figures below, you can see how easy it is to set up a new Business Journey for loan approvals and visualize the impact of delays through the lens of the business.
Experience Level Management (XLM)
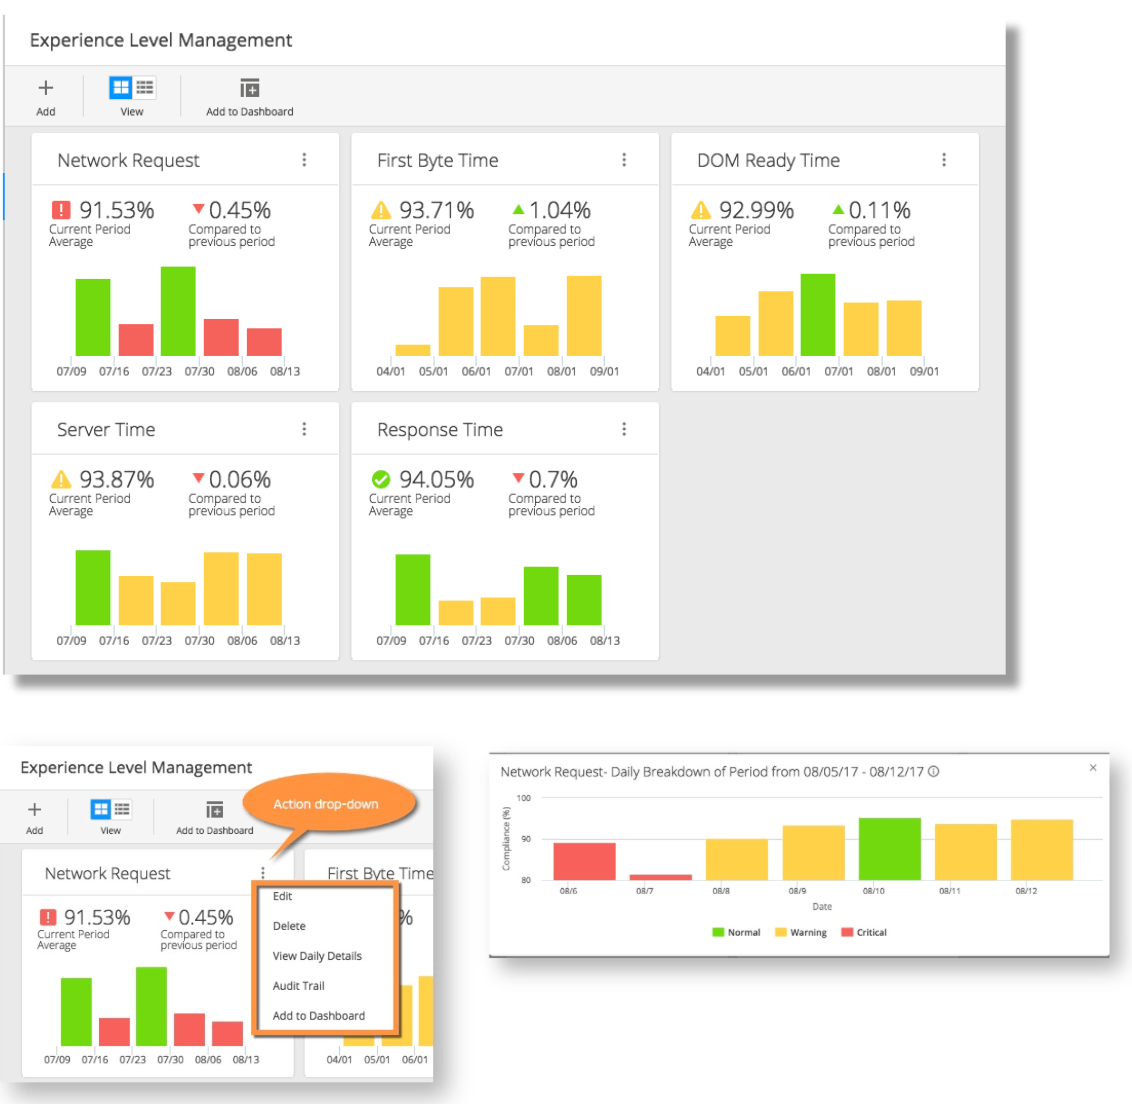
With XLM, enterprises can establish custom service-level thresholds by customer segment, location, or device. For example, the CIO of a major retailer may deliver tailored experiences to its top customers by setting performance thresholds across its customer channels — including website, mobile apps, in-store wireless, and in-store checkout. XLM also provides an immutable audit for service-level agreements with your customers or internal business units. The product images below show the service levels setup for a connected streaming device, giving an instant view on how services are performing against set SLAs.
Network Visibility
Application developers, IT Ops and network teams often work in silos using a myriad of different monitoring tools. To troubleshoot application performance issues, war rooms are created, and the lack of a common language and visibility across different tools results in finger pointing, endless debates, and slower Mean Time to Resolution (MTTR).
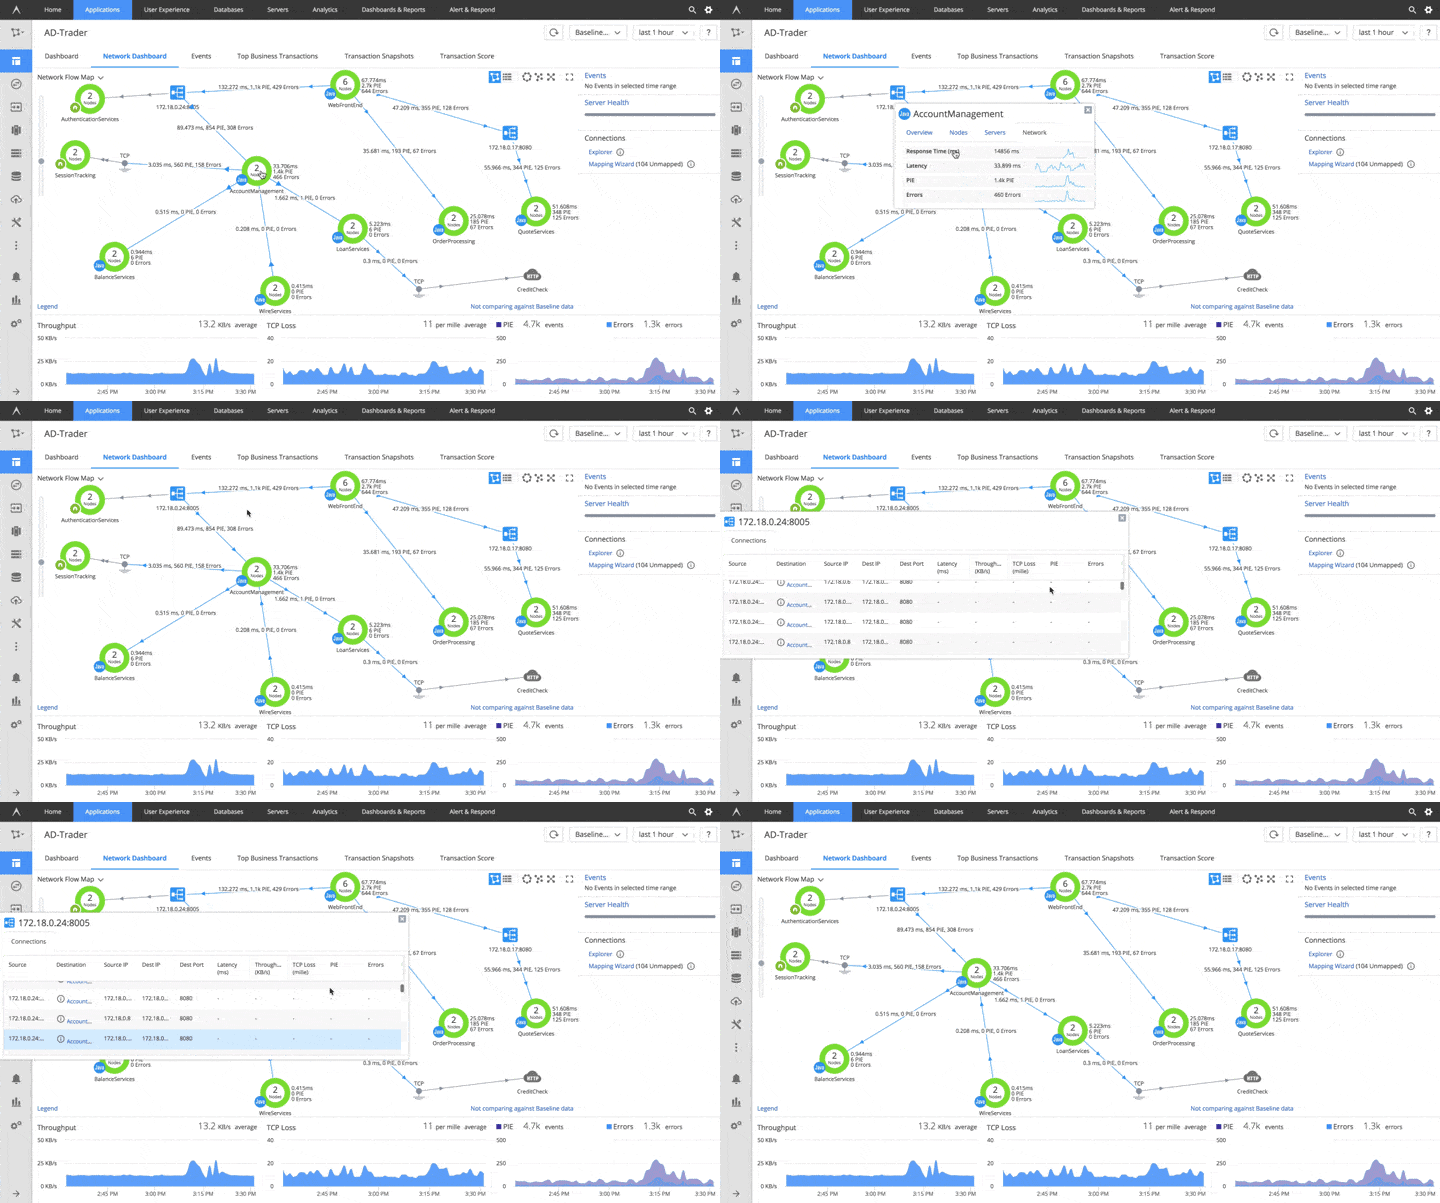
With the introduction of AppDynamics Network Visibility, a capability AppDynamics is uniquely positioned to address now as part of Cisco, enterprises will be able to understand the impact that the network is having on application and business performance. Network performance measurements are automatically correlated with application performance in the context of the Business Transaction. IT teams will be able to triage network issues with one single pane of glass and provide the right information to network teams before there is an impact on the end-user experience. Finally, an answer to end-to-end visibility from customer, to code, to network is here.
AppDynamics automatically discovers network devices such as reverse proxy load balancers deployed on-premises and in cloud environments and eliminates the need to use expensive network tools such as SPAN/TAP to capture and analyze network traffic.
The animation below shows out-of-box visibility into network flow maps, network metrics such as latency, throughput, retransmission rates, and critical errors, enabling IT Ops to quickly identify and isolate root cause without the need to engage network teams.
AppDynamics IoT
IoT devices create another channel to engage with customers, and if properly measured and optimized, can create game-changing business benefits. With new IoT visibility, businesses can convert rich and invaluable insights into consumer behavior, buying patterns, and business impacts. IoT visibility includes:
Device analytics — Together with Business iQ, IoT visibility provides an unprecedented insight into how IoT devices are driving business impact. And because these insights are delivered through a single platform, IoT visibility is the first and only solution that maps and correlates entire customer journeys — from the device to customer touchpoint, to business conversions.
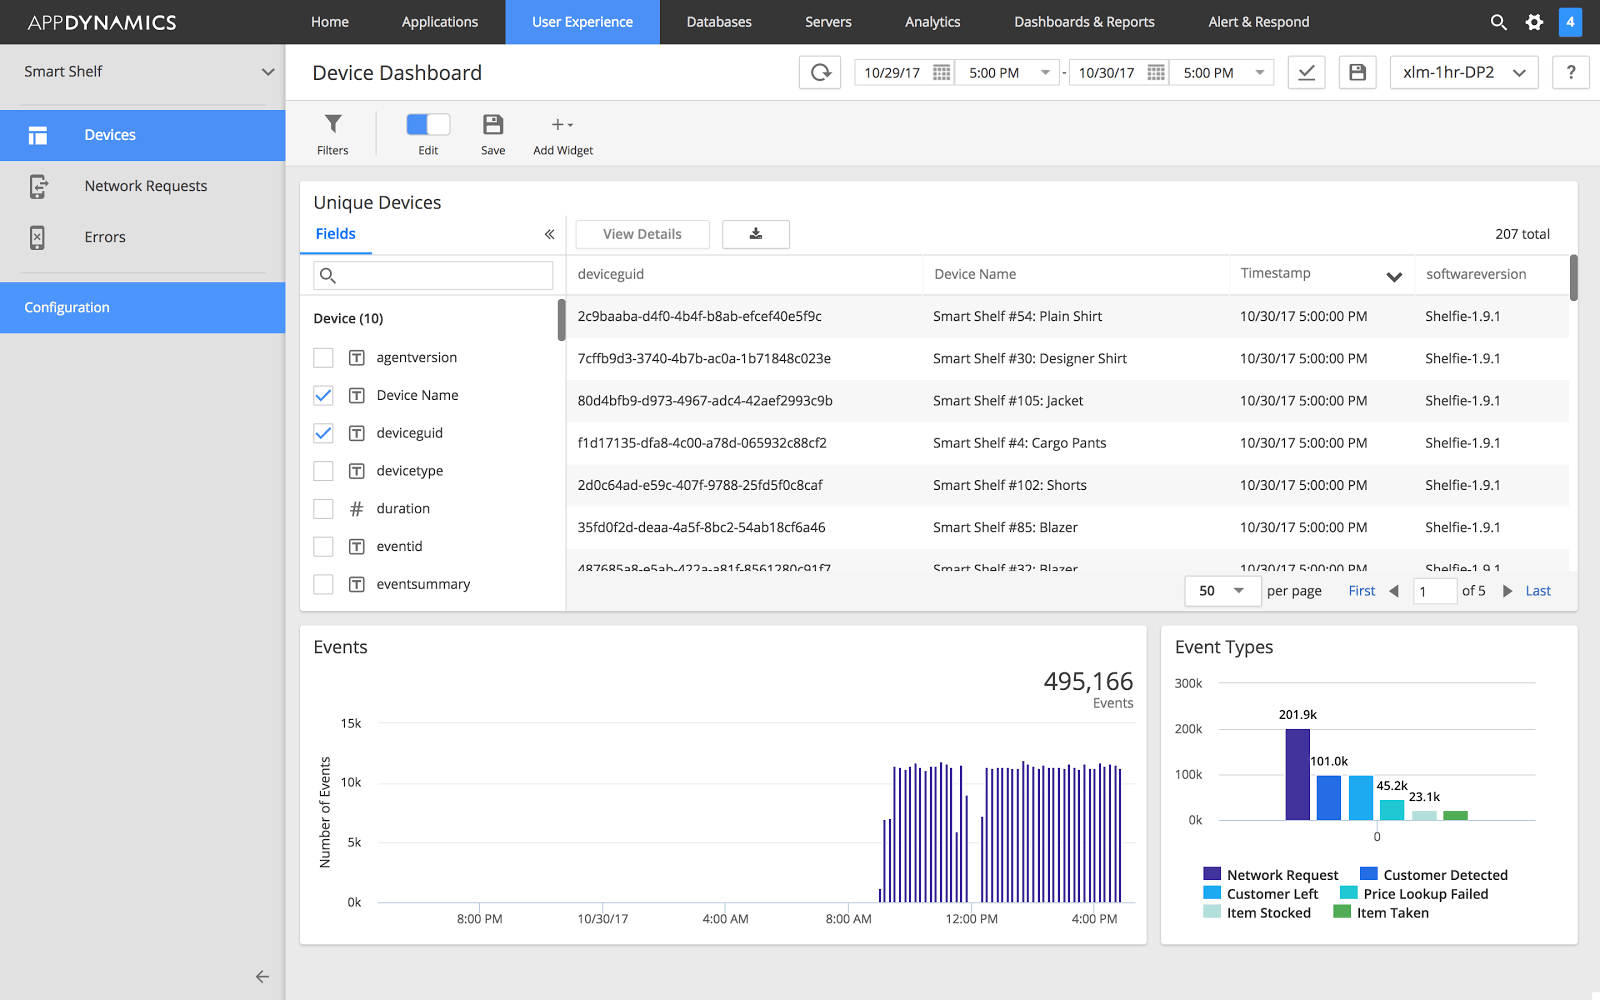
Device application visibility and troubleshooting — AppDynamics’ new IoT visibility provides an aggregated view into device uptime, version status, and performance, enabling drill-down views into the device to simplify the troubleshooting of IoT applications. The screenshot below shows a list view of all active devices. A simple double-click on a specific device takes you to the device details.
Custom dashboards — Every company measures success differently. With custom dashboards in IoT visibility, companies from any vertical can quickly build new visualizations to measure the business impact of IoT devices — from the revenue impact of a slow checkout for a brick and mortar retailer, to the customer impact of a software change in a connected car.
Synthetic Private Agent
AppDynamics Winter ‘17 Release brings Browser Synthetic Monitoring to your internal network. By running Synthetic Private Agent on-premises, you can monitor the availability and performance of internal websites and services that aren’t accessible from the public Internet. You can also test specific locations within your company and set alerts when performance issues occur and fix them before end-user experience is impacted.
Cross-Controller Federation
As application teams start using microservices architecture, the scalability requirements have exploded, necessitating APM scale. With Cross-Controller Federation, AppDynamics is taking unified monitoring to the next level. Our customers can achieve limitless scalability and flexibility to deploy application components across multiple public and private clouds.
Only with AppDynamics, customers get complete correlated visibility and quick drill-down into the line of code, irrespective of where the application components and controllers are deployed, because controllers can participate in a federation. Another important use case is keeping APM data isolated by deploying multiple controllers yet maintaining correlated visibility for compliance, architecture, and business reasons.
KPI Analyzer
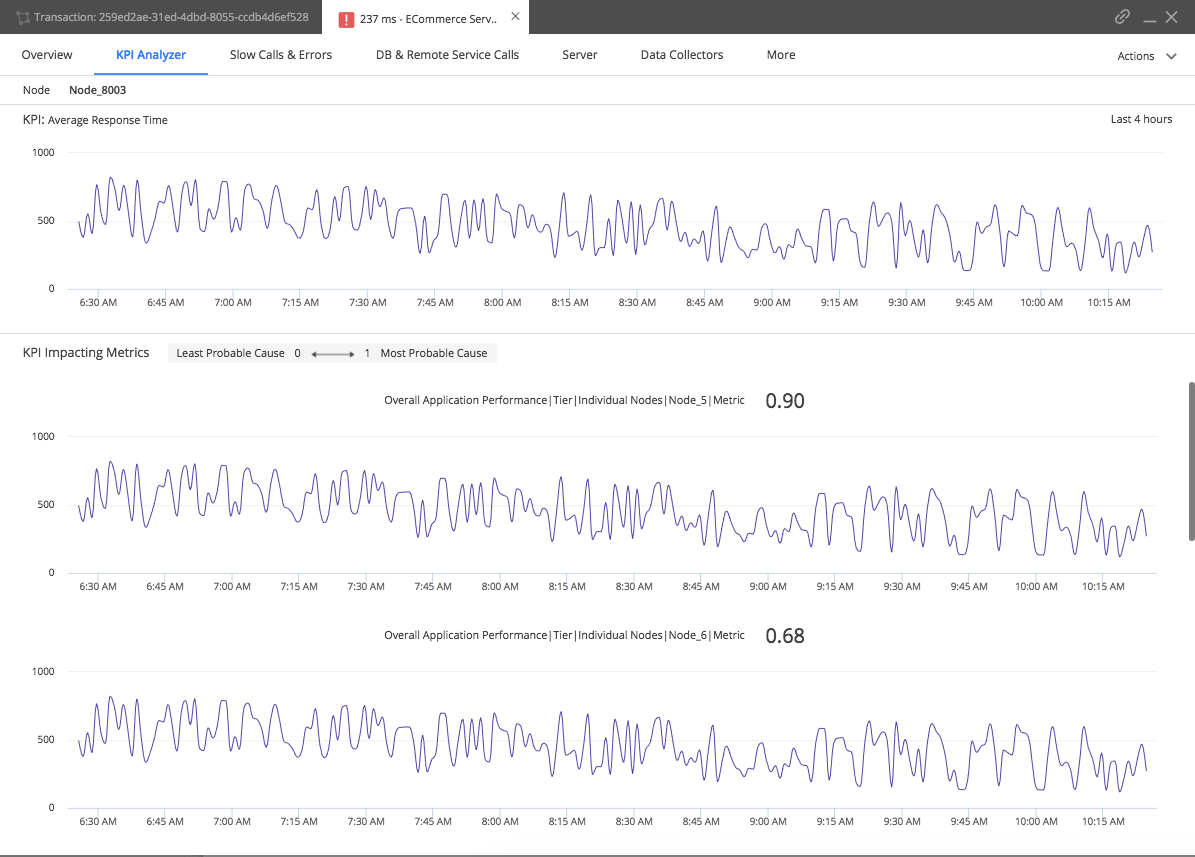
KPI Analyzer applies machine learning to automate root cause analysis. With the KPI analyzer, customers can isolate the metrics that are the most likely contributors to poor performance, and identify the likely degree of impact on the KPI for each metric, automatically. The KPI analyzer makes troubleshooting root cause as simple as clicking a prompt to surface the underlying issue most likely to be the root cause of degraded performance.
The following figure shows KPI Analyzer in action. KPIs such as average response time are displayed with metrics that are automatically identified as the root cause and scored in ranked order for quick resolution.
Learn More
AppDynamics’ Winter ‘17 Release is rich with other important features such as Universal Agent to simplify agent installation and configuration, Enterprise Console for streamlined controller lifecycle management, and Node.js flame graph for deeper visibility, among several other features. Learn more about all features by visiting our comprehensive product documentation page.
Get started with the free trial of AppDynamics Winter ‘17 today!
Discover faster, more efficient performance monitoring with an enterprise APM product learning from your apps. Take the AppDynamics APM Guided Tour!


