Create source maps at project build time for JavaScript debugging
If you’re doing front end web development, your web resources such as JavaScript and CSS files might be minificated, transpiled or compiled from a completely different language.
If you now want to debug the generated code in the browser, you can not do that because the output code is obfuscated from the code you wrote. The solution is to use source maps.
A good introduction to the source map can be found in the following articles:
- Introduction to JavaScript Source Maps
- Enhance Your JavaScript Debugging with Cross-Browser Source Maps
- An Introduction to Source Maps
I will try to summarize the quintessence about the source maps and concentrate on JavaScript only. Generating CSS by LESS / SASS is interesting too, but it is not yet supported by my Maven plugin.
How to use a source map? In order to use a source map, your browser development tools need to be able to find it. If your generated code is JavaScript, one way to let the development tools know where to look is to add a comment to the end of the generated code which defines the sourceMappingURL – the location of the source map. For example:
# sourceMappingURL=mylib.js.map or
# sourceMappingURL=/mypath/mylib.js.map or
# sourceMappingURL=http://sourcemaps/mylib.js.map.
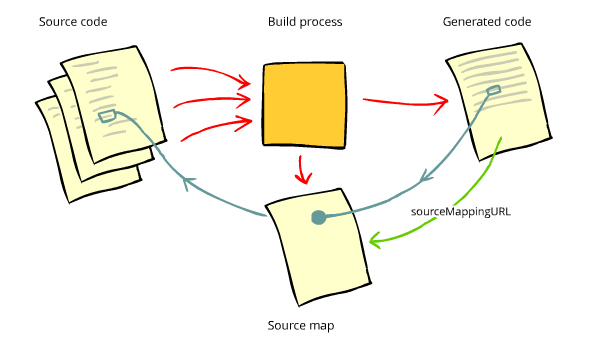
If you now open a development tool and the source map support is enabled, the browser will stream down the source map which points to the original file and show the original file instead of generated one (minificated, compiled, transpiled, etc.). Now, you can set a breakpoint in the original file and debug it as it would be delivered with you web application! Such debugging is possible due to the fact that a source map provides a way of mapping code within a generated file back to it’s original position in a source file. I found a nice build here to visualize the entire process.
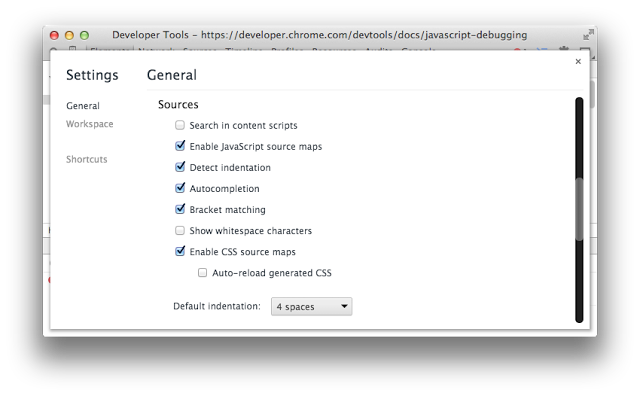
Source maps are supported in all major browser that are shipped with built-in support for source maps. If you follow my links to the articles I mentioned above, you can see some examples for Internet Expoler 11, Firefox and Google Chrome. Chrome’s Dev Tools enables the source maps support by default. Simple check if the checkbox “Enable JavaScript source maps” is enabled.
If you a fan of Firefox, you should use the Firefox’ Web Console (Shift + Ctrl + K) and check if the same option is enabled in settings too. Please note that Firebug doesn’t support debugging by source maps. You have to use the native Firefox’ Web Console as I said. Internet Explorer 11 also rocks with source maps. It has even more features – you can add source map files from your local disk. Simple right-click on a generated (e.g. compressed) file and select “Choose source map”.
The article Enhance Your JavaScript Debugging with Cross-Browser Source Maps which I mentioned above, has a lot of pictures for IE and debugging TypeScript files.
Source maps can be created during your build. If you work with Node.js and npm, the best tool is UglifyJS – a popular command line utility that allows you to combine and compress JavaScript files. If you work with Maven, you can use my Maven plugin for resource optimization I wrote a some years ago and just updated for supporting source maps.
It uses the superb Google Closure Compiler which offers a support for source map creation and many other cool features. Please refer to the documentation of the Maven plugin to see how to set the various source map configuration options. The simplest configuration which we also use in the current PrimeFaces Extensions release looks like as follows:
<plugin>
    <groupId>org.primefaces.extensions</groupId>
    <artifactId>resources-optimizer-maven-plugin</artifactId>
    <version>2.0.0</version>
    <configuration>
        <sourceMap>
            <create>true</create>
            <outputDir>${project.basedir}/src/sourcemap/${project.version}</outputDir>
            <sourceMapRoot>
              https://raw.githubusercontent.com/primefaces-extensions/core/master/src/sourcemap/${project.version}/
            </sourceMapRoot>
        </sourceMap>
    </configuration>
    <executions>
        <execution>
            <id>optimize</id>
            <phase>prepare-package</phase>
            <goals>
                <goal>optimize</goal>
            </goals>
        </execution>
    </executions>
</plugin>
By this way, only compressed JavaScript files will be packaged within released JAR file. Uncompressed files are not within the JAR. The JAR is smaller and free from redundant stuff. For the PrimeFaces Extensions, the source map and uncompressed files are checked in below the project root. For example, the folder with source maps and original files for the current release 3.2.0 is located here: https://github.com/primefaces-extensions/core/tree/master/src/sourcemap/3.2.0. That means, a compressed file, say timeline.js, has the following line at the end:
# sourceMappingURL=https://raw.githubusercontent.com/primefaces-extensions/core/master/src/sourcemap/3.2.0/timeline.js.map
The source map timeline.js.map has the content (I truncated some long lines):
{
  "version":3,
  "file":"timeline.js",
  "lineCount":238,
  "mappings":"A;;;;;;;;;;;;;;;;;;;;AA4DqB,WAArB,GAAI,MAAOA,MAAX,GACIA,KADJ,CACY,EADZ,CAUsB,YAAtB,GAAI,...
  "sources":["timeline.source.js"],
  "names":["links","google","undefined","Array","prototype","indexOf","Array.prototype.indexOf",...]
}
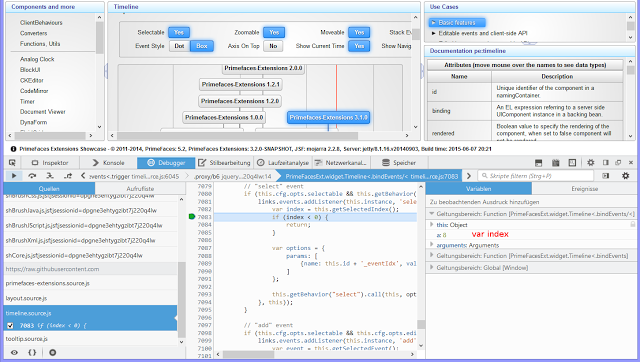
It would be probably better to bring these files to a CDN, like cdnjs, but CDNs are not really intended for source maps. Another option would be a PrimeFaces repository. We will see how to handle that in the future. The next picture demonstrates how the debugging for the compressed JS file timeline.js looks in my Firefox.
Due to the Firefox built-in source map support we see the uncompressed JS file timeline.source.js. I set a breakpoint on the line with the if-statement if (index < 0). After that I clicked on an event in the Timeline component. The breakpoint was jumped up. Now, I can debug step by step and see my local and global variables on the right side. As you probably see, the variable index is shown as a (I marked it red as var index). This is a shortcoming of the current source map specification. You can read this discussion for more details.
Again, keep in mind – the source maps and original files will be only loaded when you open up the browser dev. tools and enable this support explicitly. If the dev. tools has identified that a source map is available, it will be fetched along with referenced source file(s). If a source map file is not available, you will see a 404 “not found message” in the dev. tool (not bad at all in my opinion).
That’s all. My next posts will be about AngularJS and less about JSF. Stay tuned.
| Reference: | Create source maps at project build time for JavaScript debugging from our WCG partner Oleg Varaksin at the Thoughts on software development blog. |


