The AppD Approach: Using Flame Graphs to Debug Node.js Apps
Discover faster, more efficient performance monitoring with an enterprise APM product learning from your apps. Take the AppDynamics APM Guided Tour!
In my day job, I work to help people understand performance and reliability issues in distributed applications across a number of different technologies including Java, .NET, and Node.js. A few years ago, I started to see a rise in the adoption of Node.js, with some large organizations like PayPal making a major shift to the language. This trend has continued and I now find myself working with Node.js in my own projects on a regular basis. One of the challenges I faced when first learning to understand Node.js performance data was getting my head around the concept of the Event Loop, and which parts of the event lifecycle were the most important to pay attention to. This is where Flame Graphs came in.
Flame Graphs were invented by Brendan Gregg in 2011 while he was working to understand CPU usage and its role in diagnosing a MySQL performance issue. In doing so, Gregg created a visualization which ended up being ideally suited to helping interpret data which is sampling a stack, for example a set of Node.js stacks taken from a cycle of the Event Loop. Since 2011 these graphs have been used for a number of different purposes including looking at resource usage, method invocations and file systems.
To gather information to help understand where time is spent in Node.js, it’s common to use the V8 Profiler which is part of the Node.js V8 Engine. This collects data about the event loop including where it spends time, what it puts on the heap, and what specific function is blocking the Event Loop. Interpreting this data in raw text, or even a tree can be difficult and time consuming. The data is great, but getting insight from it relies on experience. Once a Flame Graph is used to understand this data, it becomes a lot easier to identify where bottlenecks are occuring.
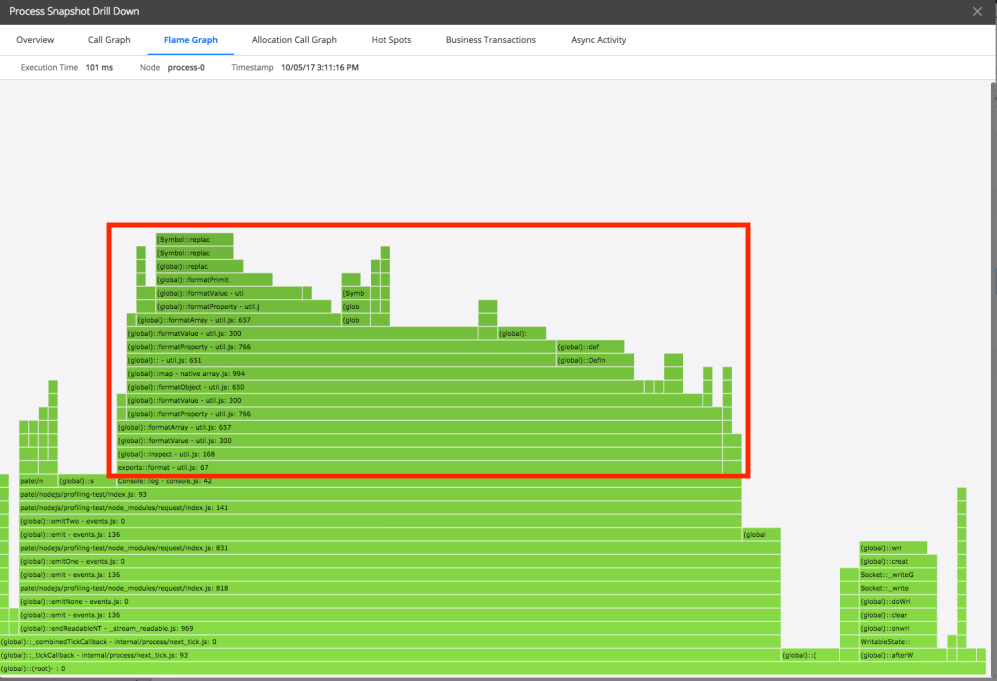
The example below is intentionally simple but it follows the same basic concept Brendan invented. Across the X-Axis are samples which are periodically taken of the Event Loop using the V8 Profiler, telling us what function is currently executing. On the Y-Axis we have the stack for that function call. Now we can see where the code can be optimized. I’ve added a red box to show the data of interest. At the bottom of this section we see a call to the formatValue function, which then proceeds through formatValue and formatArray eventually leading back to this same code with a couple of levels of recursion. With this information in hand, I now know where I can get the biggest benefit to any change, and perhaps equally important, which parts of the codebase are likely to yield little improvement as they don’t contribute a significant amount of execution time.
At AppDynamics, we have been monitoring Node.js applications for some time, but we’ve recently added flame graphs to bring the value of these visualizations to our debugging process. I’ve had the chance to work with a number of our customers and they find these a great addition to our solution. It has helped remove some of the application knowledge which they needed previously to get to the root cause of event loop slowdown issues. This is helping Operations and on-call DevOps engineers to more easily triage problems with code they are unfamiliar with or didn’t develop.
You can find more information on how AppDynamics can help with identifying event loop blocking here.
Changes like this may seem small, but adding flame graphs to the existing end-to-end monitoring across multi-technology environments can have a major impact on mean time to resolution. If you’re not already using AppDynamics to monitor your Node.js applications, you can sign up for a free trial to see what you think.
Discover faster, more efficient performance monitoring with an enterprise APM product learning from your apps. Take the AppDynamics APM Guided Tour!


