Monitoring Your Asynchronous Python Web Applications Using Prometheus
In my last article, we saw how we can integrate the Prometheus monitoring system with synchronous Python applications. We focused on WSGI applications such as those written in Flask or Django and deployed using uwsgi or gunicorn. In this post, we will discuss integrating Prometheus with asynchronous web applications written using aiohttp, an HTTP client/server framework built upon asyncio.
Software Requirements
The sample Python application we will follow along with is tested with Python 3.5+. In addition, we will be using docker (v1.13) and docker-compose (v1.10.0) to run the web application, as well as the other software we will be using. If you don’t have these installed, please follow the official install guide to install these on your operating system.
All the source code we will need to follow along with is in a git repository.
Our Python Web Application
Our Python web application is as follows:
from aiohttp import web

async def test(request):
    return web.Response(text='test')

async def test1(request):
    1/0

if __name__ == '__main__':
    app = web.Application()
    app.router.add_get('/test', test)
    app.router.add_get('/test1', test1)
    web.run_app(app, port=8080)
We expose two HTTP endpoints: test, which simply returns “test”, and test1, which triggers a runtime exception resulting in a 500 Internal Server Error HTTP response. As is typical of web applications, we would want to wrap any unhandled exceptions in a proper error response using a middleware as follows:
@asyncio.coroutine
def error_middleware(app, handler):

    @asyncio.coroutine
    def middleware_handler(request):
        try:
            response = yield from handler(request)
            return response
        except web.HTTPException as ex:
            resp = web.Response(body=str(ex), status=ex.status)
            return resp
        except Exception as ex:
            resp = web.Response(body=str(ex), status=500)
            return resp

    return middleware_handler
...
app = web.Application(middlewares=[error_handler])
..
middleware_handler() gets called before processing the request. Hence we first call the handler with the request (yield from handler(request)) and return the response. If however we get an exception, we perform additional processing.
We have two exception handling blocks to handle two different kinds of exceptions. An exception of type web.HTTPException is raised in cases handled by the server such as as requests that result in HTTP 404 responses. These exception objects have the status attribute set to the corresponding HTTP status code. The other exception block handles any other error condition which hasn’t been handled by the server (such as the ZeroDivisionError raised by the test1 endpoint). In this case, we have to set the status code ourselves and we set it to 500.
If you need to refer to how the web application looks at this stage, see this commit.
At this stage, we have a basic web application written using aiohttp which we can further expand upon as per our requirements using one of the many asyncio-aware libraries. Almost orthogonal to the specific functionality the web application will finally provide, we will want to calculate the basic metrics for a web application and use a monitoring system to aggregate these metrics, which in our case is prometheus.
Exporting Prometheus Metrics
Next, we will modify our web application to export the following metrics:
- Total number of requests received
- Latency of a request in seconds
- Number of requests in progress
Prometheus classifies metrics into different types, which tells us that the metrics of our choice above are a counter, histogram, and a gauge respectively. We will write another middleware to initialize, update, and export these metrics.
First, we will initialize the metric objects and register a handler function for handling requests to the /metrics endpoint:
from prometheus_client import Counter, Gauge, Histogram
import prometheus_client

async def metrics(request):
    resp = web.Response(body=prometheus_client.generate_latest())
    resp.content_type = CONTENT_TYPE_LATEST
    return resp


def setup_metrics(app, app_name):
    app['REQUEST_COUNT'] = Counter(
      'requests_total', 'Total Request Count',
      ['app_name', 'method', 'endpoint', 'http_status']
    )
    app['REQUEST_LATENCY'] = Histogram(
        'request_latency_seconds', 'Request latency',

    app['REQUEST_IN_PROGRESS'] = Gauge(
        'requests_in_progress_total', 'Requests in progress',
        ['app_name', 'endpoint', 'method']
    )

    app.middlewares.insert(0, prom_middleware(app_name))
    app.router.add_get("/metrics", metrics)
The prom_middleware function is where the updating of the metrics is done for every request:
def prom_middleware(app_name):
    @asyncio.coroutine
    def factory(app, handler):
        @asyncio.coroutine
        def middleware_handler(request):
            try:
                request['start_time'] = time.time()
                request.app['REQUEST_IN_PROGRESS'].labels(
                            app_name, request.path, request.method).inc()
                response = yield from handler(request)
                resp_time = time.time() - request['start_time']
                request.app['REQUEST_LATENCY'].labels(app_name, request.path).observe(res
p_time)
                request.app['REQUEST_IN_PROGRESS'].labels(app_name, request.path, request
.method).dec()
                request.app['REQUEST_COUNT'].labels(
                            app_name, request.method, request.path, response.status).inc(
)
                return response
            except Exception as ex:
                raise
        return middleware_handler
    return factory
The web application code will then be modified to call the setup_metrics() function as follows:
setup_metrics(app, "webapp_1")
Note that we insert the prom_middleware() in front of all other registered middlewares in the setup_metrics() function above (app.middlewares.insert(0, prom_middleware(app_name)). This is so that the Prometheus middleware is called after all other middlewares have processed the response.
One reason for this being desirable is when we have also registered an error handler as above, the response will then have the status set correctly when the Prometheus middleware is invoked with the response.
Our web application at this stage looks as per this commit. prom_middleware() and error_middleware() have been moved to the helpers.middleware module.
!Sign up for a free Codeship Account
Running the Application
Let’s now build the Docker image for our web application and run it:
$ cd aiohttp_app_prometheus
$ docker build -t amitsaha/aiohttp_app1 -f Dockerfile.py3 .
..

$ docker run  -ti -p 8080:8080 -v `pwd`/src:/application amitsaha/aiohttp_app1
======== Running on http://0.0.0.0:8080 ========
(Press CTRL+C to quit)
Now, let’s make a few requests to our web application:
$ curl localhost:8080/test
test                                                                           $ curl localhost:8080/test1
division by zero
$ curl loc
In addition, if you send a request to the /metrics endpoint, you will see that you get back a 200 response with the body containing the calculated Prometheus metrics.
Now let’s kill the above container (via Ctrl+C) and use docker-compose to start our web application and the Prometheus server as well using:
$ docker-compose -f docker-compose.yml -f docker-compose-infra.yml up
...
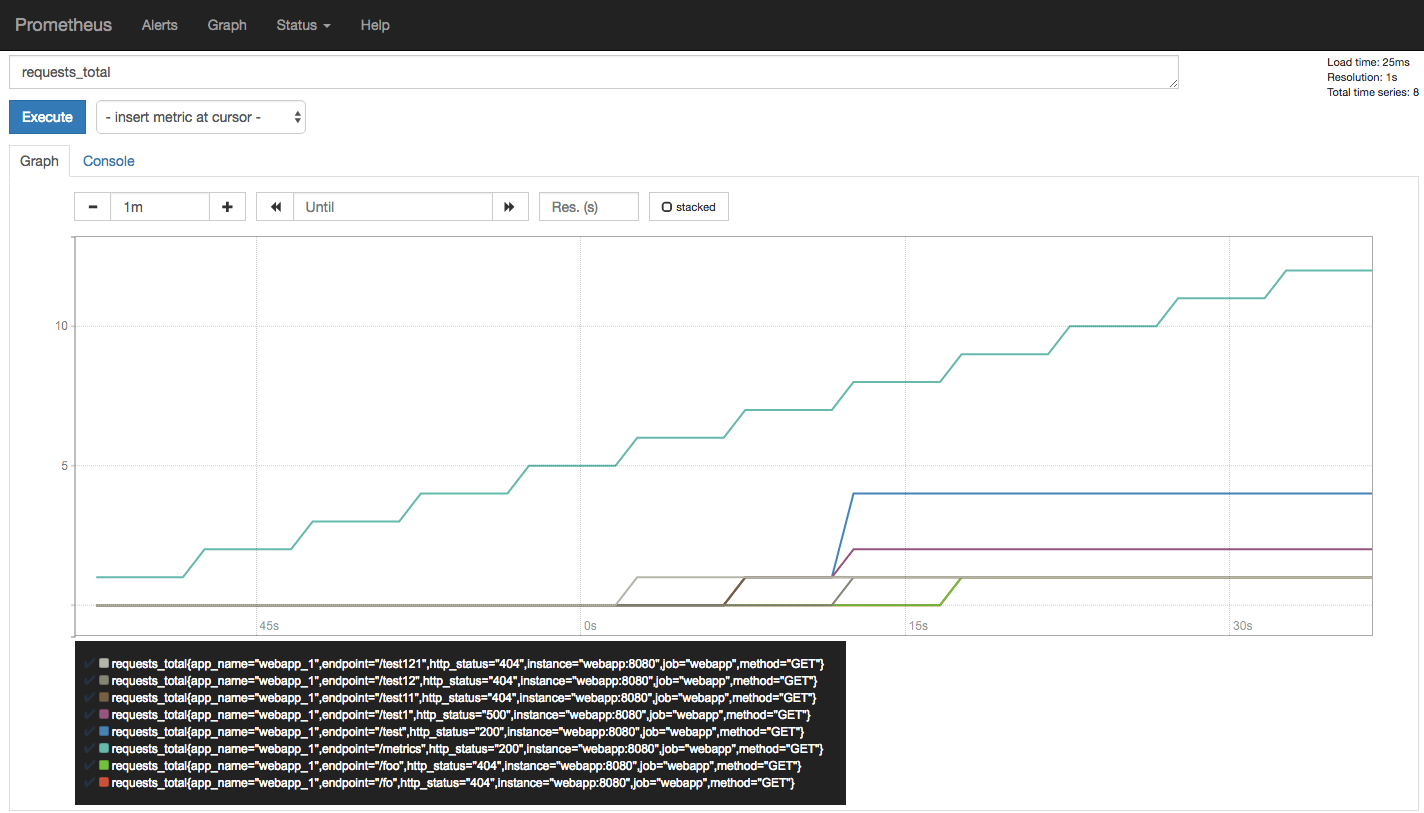
Now, if we make a few requests again as above and then open the Prometheus expression browser at http://localhost:9090 and type in one of the two metrics we exported, requests_total, you will see a graph similar to the following:
At this stage, we have our web application exporting metrics that a Prometheus server can read. We have a single instance of our application capable of serving concurrent requests, thanks to asyncio.
Hence, we haven’t come across the limitation that we came across in Part I, the previous article, where we had to run multiple worker processes to be capable of serving concurrent requests. This hindered getting consistent metrics from the web application, as any of the worker processes could be scraped by Prometheus.
Prometheus Integration in a Production Setup
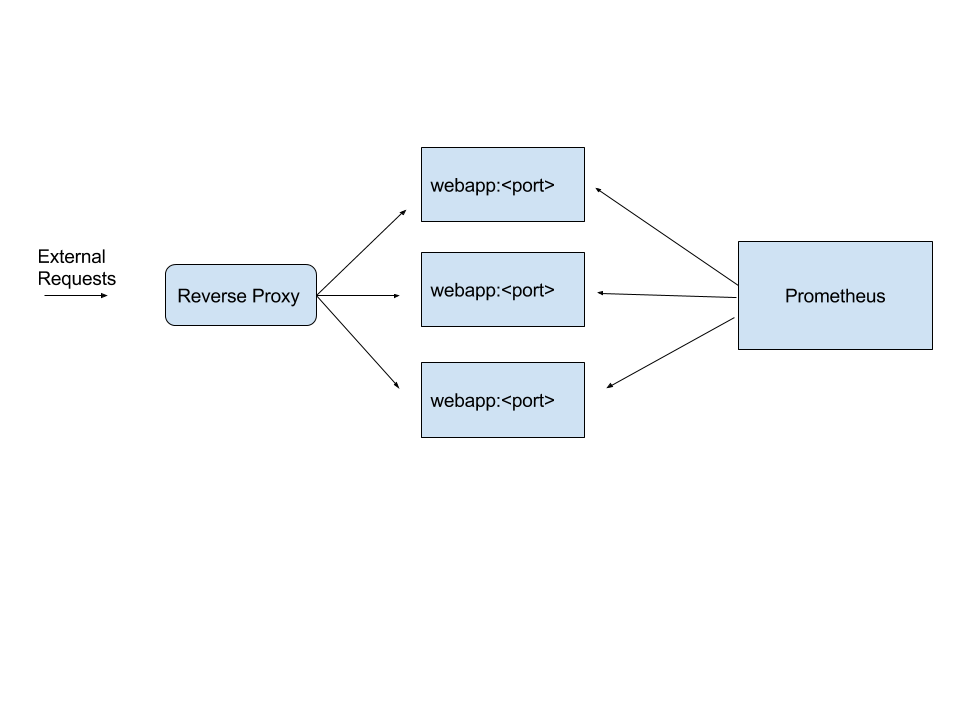
If we were deploying an aiohttp application in production, we would likely deploy it in a reverse proxy setup via nginx or haproxy. In this case, we will have a setup where requests to our web application first hit nginx or haproxy, which will then forward the request to one of the multiple web application instances.
In this case, we will have to make sure prometheus is scraping each of the web application instances directly rather than via the reverse proxy. The setup would look as follows:
When running on a single host (a virtual machine), the port each instance of the application will listen on will be different. This of course means that the communication between the reverse proxy and the individual aiohttp application instances has to be over HTTP and cannot be over faster Unix sockets.
However, if yourwere deploying the web applications using containers, this would not be an issue since you would run one application instance per container anyway and these application instances would be scraped separately.
Discovering scraping targets via service discovery
Web application instances can come and go, and the number of them running at any given point of time can vary. Hence their IP addresses can vary, and thus we need a mechanism for Prometheus to discover the web applications via a mechanism that doesn’t manually require updating the Prometheus target configuration. A number of service discovery mechanisms are supported.
Conclusion
In this post, we looked at how we can monitor asynchronous Python web applications written using aiohttp. The strategy we discussed should also work for other asynchronous frameworks (such as tornado) that support the deployment model of running multiple instances of the application, with each instance running only one instance of the server process.
We wrote the Prometheus integration middleware by hand in this post. However, I have put up the middleware as a separate package that you can use for your web applications.
| Reference: | Monitoring Your Asynchronous Python Web Applications Using Prometheus from our WCG partner Amit Saha at the Codeship Blog blog. |


